

Original content provided by
Mapping out your risk drivers through a bow tie analysis is an important part of building your risk management framework (as seen in this article of our BDO Risk Blueprint). Now, we turn to an important follow-up question: how can you monitor these drivers before they lead to incidents? The answer lies in developing effective Key Risk Indicators (KRIs) - metrics that serve as early warning signals for upcoming risks. While many organisations focus on lagging indicators that measure past events, leading KRIs allow you to monitor risk drivers proactively, giving you time to intervene before problems materialise. In this article, you will learn how to develop and implement KRIs that truly reflect your organisation’s risk profile and support informed decision-making.
Download the full presentation
What is a Key Risk Indicator?
KRIs serve as proxies for the causes of risk and are applicable across all types of operational risks. One of the key types of effective KRIs focuses on abnormalities - situations that deviate from expected patterns. This principle is familiar to anyone who has seen safety announcements like “If you see something, say something” in public transportation systems. In your organisation, developing metrics that highlight abnormal behaviours, transactions, or conditions provides powerful early warning of potential risks.
For example: in fraud detection, abnormal transaction patterns serve as leading indicators. Credit card companies have used this approach for decades, flagging unusual spending patterns as potential signs of fraud before significant losses occur. Similarly, in trading operations, deviations from normal trading activity can signal potential misconduct.
The six-step KRI development process
Creating an effective KRI program requires a systematic approach. While this demands effort, the resulting insights are well worth the investment for your key risks. Here is a six-step process to guide your implementation:
1. Identify your organisation’s key risks
Begin by focusing on your most significant risks, those that could materially impact your organisation’s objectives. Attempting to monitor every possible risk would be impractical and inefficient. If you have already completed a Risk and Control Self-Assessment as outlined in a previous article, you will have a clear starting point for this step.
2. Understand causes and root causes
For each key risk, identify the primary drivers and root causes. This is where bow tie analysis from our previous article proves invaluable, providing a systematic approach to mapping risk causes. Remember to focus particularly on areas where your organisation has historically struggled, as these represent your greatest improvement opportunities. Focus your monitoring mostly on what you can improve, not only on what you are already doing well.
3. Recycle existing metrics
Before developing new metrics, look at what you are already measuring. Your existing Key Performance Indicators (KPIs) and Key Control Indicators (KCIs) can often serve as effective KRIs:
- Failed performance indicators: when KPIs turn amber or red, they become KRIs. A weakening performance is a sign of troubles ahead
- Failed control indicators: when key controls are weak, they directly elevate the risks they are meant to mitigate
For example, if your IT department already monitors system response times as a performance indicator, declining performance does not just signal customer experience issues – it is also a leading indicator of potential system failure risks.
This recycling approach – reusing your KPIs and KCIs as KRIs - provides a quick win for your KRI program, leveraging data you already collect and reducing implementation effort.
4. Identify missing metrics
After reviewing existing metrics, identify any gaps in your monitoring. Are there important risk drivers that remain unmeasured? Develop additional metrics as needed to ensure comprehensive coverage of your key risk causes. For each missing metric, consider what data would effectively proxy the underlying risk driver.
5. Design your implementation approach
Once you know what you want to measure, determine how to implement these metrics in practice:
- Data sources: where will the information come from?
- Reporting frequency: how often should each KRI be measured and reported?
- Governance structure: who will review the KRIs and take action when thresholds are breached?
- Thresholds: what levels indicate normal operations, increased vigilance, and required action?
Apply the golden rule of risk reporting: the value of information reported should always exceed the cost of collection. Some theoretically useful metrics might be too costly or complex to implement in practice. Focus on those that provide the greatest insight for the smallest cost.
6. Validate through back testing
Finally, regularly assess whether your KRIs are actually helping prevent incidents. Look at cases where KRIs signalled emerging problems that were successfully addressed. Also examine incidents that occurred without prior warning from your KRIs, as these indicate gaps in your monitoring approach.
This continuous improvement loop, as shown in video 1 of the Risk Blueprint, ensures that your KRI program remains effective as your organisation and its risk environment evolve.
Four categories of Key Risk Indicators
Using four broad categories of KRIs help provide a comprehensive set of leading indicators. The first two categories typically apply organisation-wide, while the latter two are more bottom-up and process-specific. Each category below is illustrated by an example from an information security perspective.
1. Exposure indicators: monitoring your risk environment
These indicators track changes in your external environment that could increase your risk exposure. Examples include:
- Geopolitical shifts: elections, government changes or policy changes
- Regulatory changes: new requirements or enforcement priorities
- Market conditions: economic indicators or competitive landscape changes
- Extreme event warnings: natural disaster forecasts or pandemic alerts
For information security risks, an example would be tracking the number of users with super-admin access beyond your defined norms. This metric highlights increased exposure due to unnecessary access privileges, following the principle that information should be shared only on a need-to-know basis.
2. Stretch indicators: measuring organisational stress
These metrics track how much stress your organisation is experiencing, recognising that stretched resources often correlate with increased risk. They fall into three main subcategories:
- Human stretch: vacancies, turnover rates or overtime hours
- System stretch: capacity utilisation, buffer capacity reduction, and system performance metrics
- Infrastructure stretch: maintenance backlogs, renovation delays, and aging equipment
In an IT department, a classic stretch indicator is the number of change requests per staff member. As this ratio increases, the likelihood of errors during implementation typically rises as well. Similarly, in customer service operations, increasing case volumes per agent often precede quality issues and control breakdowns.
3. Failure indicators: monitoring performance and controls
These indicators track failures in your performance metrics or control functions. Examples include:
- IT response time increases
- Customer service quality declines
- Backlog in reconciliations of financial transactions
- Missing validations
In information security, an example would be overdue resolutions on penetration test recommendations. When action plans from security testing remain unimplemented, they indicate weak controls and increased vulnerability.
4. Causal indicators: tracking inherent causes
These metrics directly monitor the root causes of specific risks.
For information security, examples include metrics that track risk awareness culture, such as employee compliance with security policies or results from phishing simulation tests. Tracking repeat offenders in security testing can highlight areas requiring additional training and awareness.
Designing effective Key Risk Indicators
The effectiveness of your KRI program depends not just on what you measure, but how you design and implement your indicators. These principles will help you create KRIs that provide genuine value:
The ‘minimum meaningful’ approach
When determining how many KRIs to implement, follow the principle of the minimum meaningful - the smallest number of indicators that provide comprehensive coverage of your risk drivers. Typically, this means:
- One KRI per significant cause of each key risk
- One KRI per significant driver of impact
- Independence between indicators to minimise redundancy
This approach reduces information overload while ensuring you capture essential risk drivers. Remember that collecting and analysing metrics requires resources, so focus on those that provide the greatest insight.
Avoiding the average trap
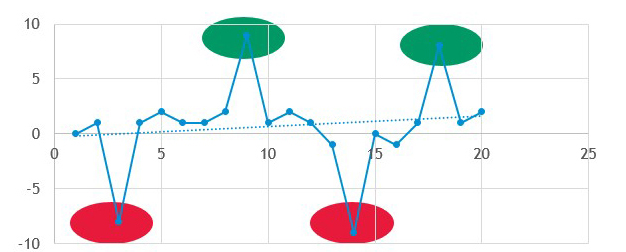
When designing KRIs, beware of relying on averages. Let’s take the example of a distribution of customer satisfaction scores across multiple service centres. While the average score might look acceptable, individual locations could be performing either exceptionally well or poorly. By focusing only on the average, you miss the valuable information contained in these deviations.
The true value in KRIs lies in identifying abnormalities - both positive and negative. Positive outliers may indicate best practices that could be implemented elsewhere, while negative outliers highlight areas requiring intervention. Set thresholds that capture these deviations rather than focusing on average performance.
Key Risk Indicators selection and reporting for an international institution
Implementing a KRI governance framework
Even the best-designed KRIs provide little value without a robust governance framework to translate insights into action. Implement these key elements to ensure your KRI program delivers results:
Colour-coded threshold framework
Establish a consistent approach to KRI interpretation across your organisation:
- Green status: continue current approach (status quo)
- Amber status: increase vigilance and monitoring as you approach the danger zone
- Red status: take action, as the risk has exceeded your defined appetite and tolerance
This colour-coded system provides a clear, visual representation of risk status that drives appropriate responses. Importantly, each colour should have predefined response protocols, reducing uncertainty of action when indicators change.
These thresholds should align with your organisation's risk appetite and tolerance levels as discussed in our article on Risk Appetite. As we explored there, your risk appetite defines not only how much risk you want to face, but also the level of residual risk you are willing to accept.
Accountability and contingency planning
For each KRI, designate:
- An indicator owner responsible for data collection, analysis, and reporting
- A risk owner accountable for action when thresholds are breached
- Contingency plans that outline response options for amber and red status
This accountability framework ensures that rising risk levels trigger appropriate responses rather than simply generating reports. Preparing contingency plans in advance allows for quicker, more effective intervention when risks escalate.
Documentation and reporting
Maintain comprehensive documentation of your KRI program, including:
- Indicator definitions and calculation methodologies
- Data sources and collection protocols
- Threshold levels and rationale
- Governance structure and responsibilities
- Historical performance and trend analysis
Documentation supports auditability while providing valuable context for decision-making. Regular reporting to key stakeholders ensures that risk insights inform strategic and operational decisions, fulfilling the role of the Three Lines of Defence model we discussed in our fifth article.
Effective Key Risk Indicators transform risk management from a reactive exercise to a proactive discipline. By monitoring the drivers of risk rather than just their outcomes, your organisation can identify emerging issues before they materialise into incidents. This early warning system allows you to intervene at the earliest possible stage, reducing both the likelihood and impact of events.
As you implement your KRI program, remember that its true value lies not in the metrics themselves, but in the actions they drive. KRIs should inform decision-making at all levels of your organisation, from strategic planning to operational responses. By connecting your indicators to clear action thresholds and accountability frameworks, you ensure that risk insights translate into tangible improvements in resilience and performance.
Ariane Chapelle